-
Offline WOM Impressions Now Stands at 14 billion per week, an Increase of 6%
-
WOM Sentiment is More Positive, an Increase of 13%
We recently marked the 15th anniversary of our firm’s journey to provide measurement of offline word of mouth – a powerful but often unmeasured part of the marketing ecosystem. Today, we integrate offline WOM measurement with social media in our TotalSocial platform, which provides powerful and unexpected insights, providing pathways to help brands grow.
As part of this anniversary celebration, our CEO Ed Keller had a fascinating conversation with some of our first clients who reflected on why they became early proponents for word-of-mouth measurement and marketing, and why they remain passionate about it today. Those conversations can be found here.
Today, we further look at some of the key WOM statistics from our early measurement days, comparing them to today to see what’s changed, and what hasn’t.
Here are 5 key findings that demonstrate offline WOM, which has always been a powerful force in the consumer decision journey, is even bigger today. Online buzz has grown dramatically since then, but not at the expense of offline.
 Billions and Billions
Billions and Billions was the name of a book by the famed astronomer Carl Sagan. It is also the amount of weekly word of mouth impressions about products, services and brands. Then, as now, people are often shocked by the sheer volume of people talking about brands.
Back in 2007, there were an eye popping 13.2 billion weekly offline word of mouth impressions about brands. (By offline, we mean conversations taking place face-to-face, phone, emailing, texting, IM’ing, video chat – in other words, via any channel other than posting on social media.) That, of course, was when Facebook was in its infancy, having just opened itself to anyone, and there was no Twitter, no Instagram, and generally online social media was quite nascent.
So where do things stand today?
The volume of offline WOM impressions now stands at 14 billion per week, an increase of 6%.
The takeaway: Far from eroding offline WOM, social media and offline WOM coexist quite well.
 Changing WOM Landscape by Category: Food/dining is the Biggest Gainer, Automotive and Telecom Saw the Biggest Drops
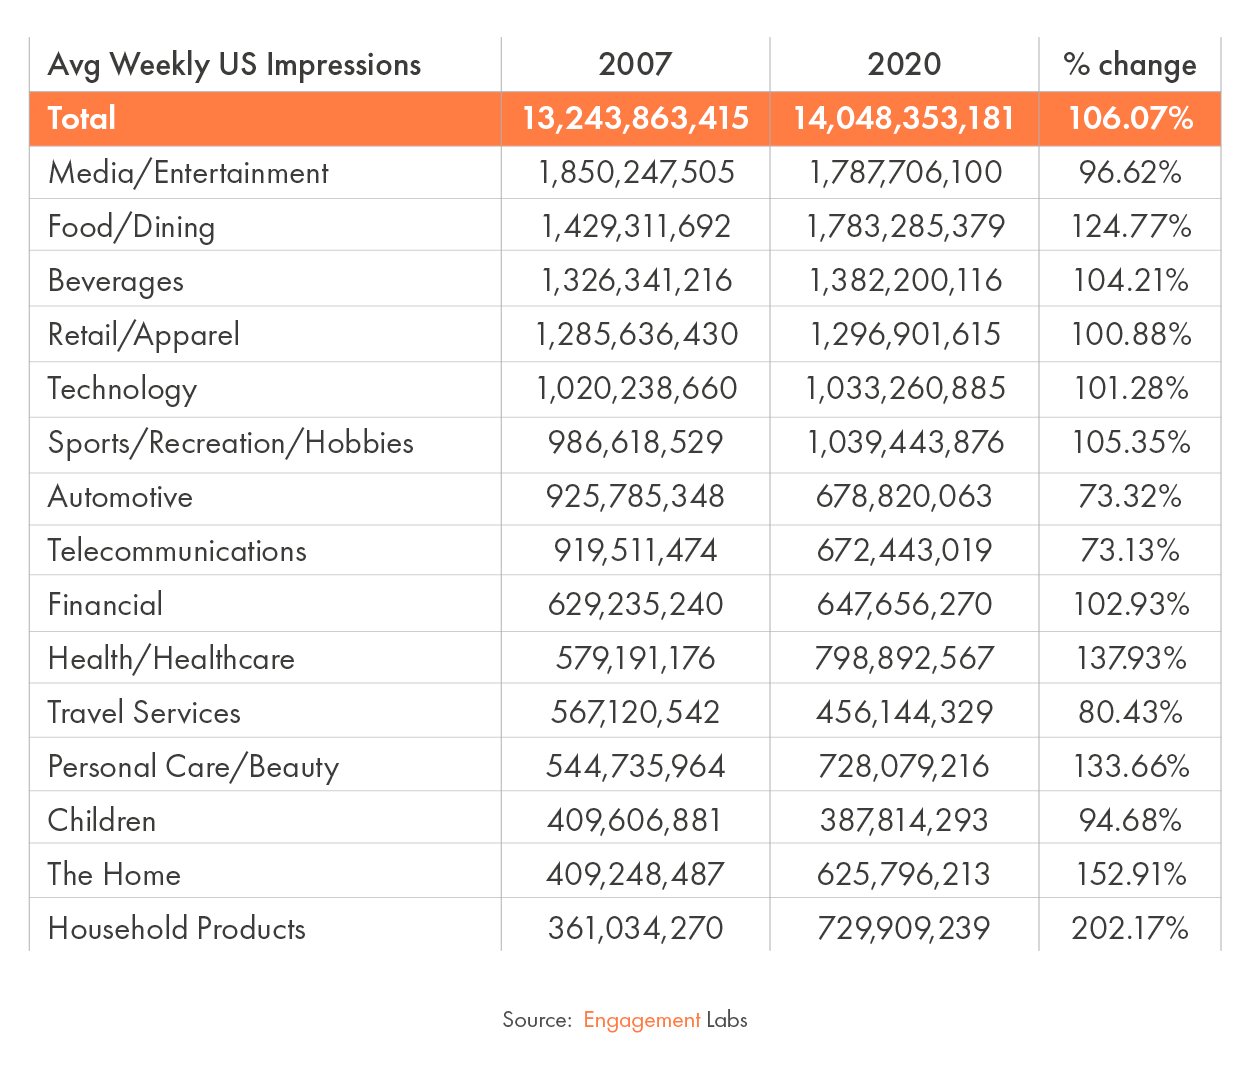
The top 5 categories for offline WOM in 2007 remain largely the same today. All have about the same volume today as then, with the exception of food/dining which has grown dramatically:
- Media/entertainment: 1.8b weekly WOM impressions, 97% of what it was in 2007
- Food/dining: 1.8b, +25%
- Beverages: 1.4b, +4%
- Retail/apparel: 1.3b, +1%
- Technology: 1b, +1% from 2007; Sports/Rec/Hobbies: 1.4b, +5% in 2020
Some other categories that have grown sharply from 2007 are health/healthcare (+38%, an increase that is partly driven by the pandemic, but even before then it had grown by 22%); personal care/beauty (+34%); the home (+53%); and household products (+102%). Categories in decline are automotive (-27%); telecom (-27%); and travel (-20%).
 Offline Sentiment is Quite Positive – Both Then and Now – and Becoming Even More So
Unlike social media, where people come to share the best of their lives but also express their frustrations (often to the brands themselves), offline WOM is different. We have long understood that the “ask” in offline WOM is for advice about good products and services to buy.
In 2007, nearly two-thirds of offline WOM was mostly positive, while less than 10% was mostly negative. The overall net sentiment was +41. (We calculate net sentiment by subtracting mostly negative and mixed -- (some positive and some negative -- from the mostly positive.)
Today, the net sentiment is even higher: +47, representing an increase of 13%. This is on the strength of increasing positive WOM -- +7%. Fully 69% of all offline WOM conversations are now positive. Only 7% are mostly negative.
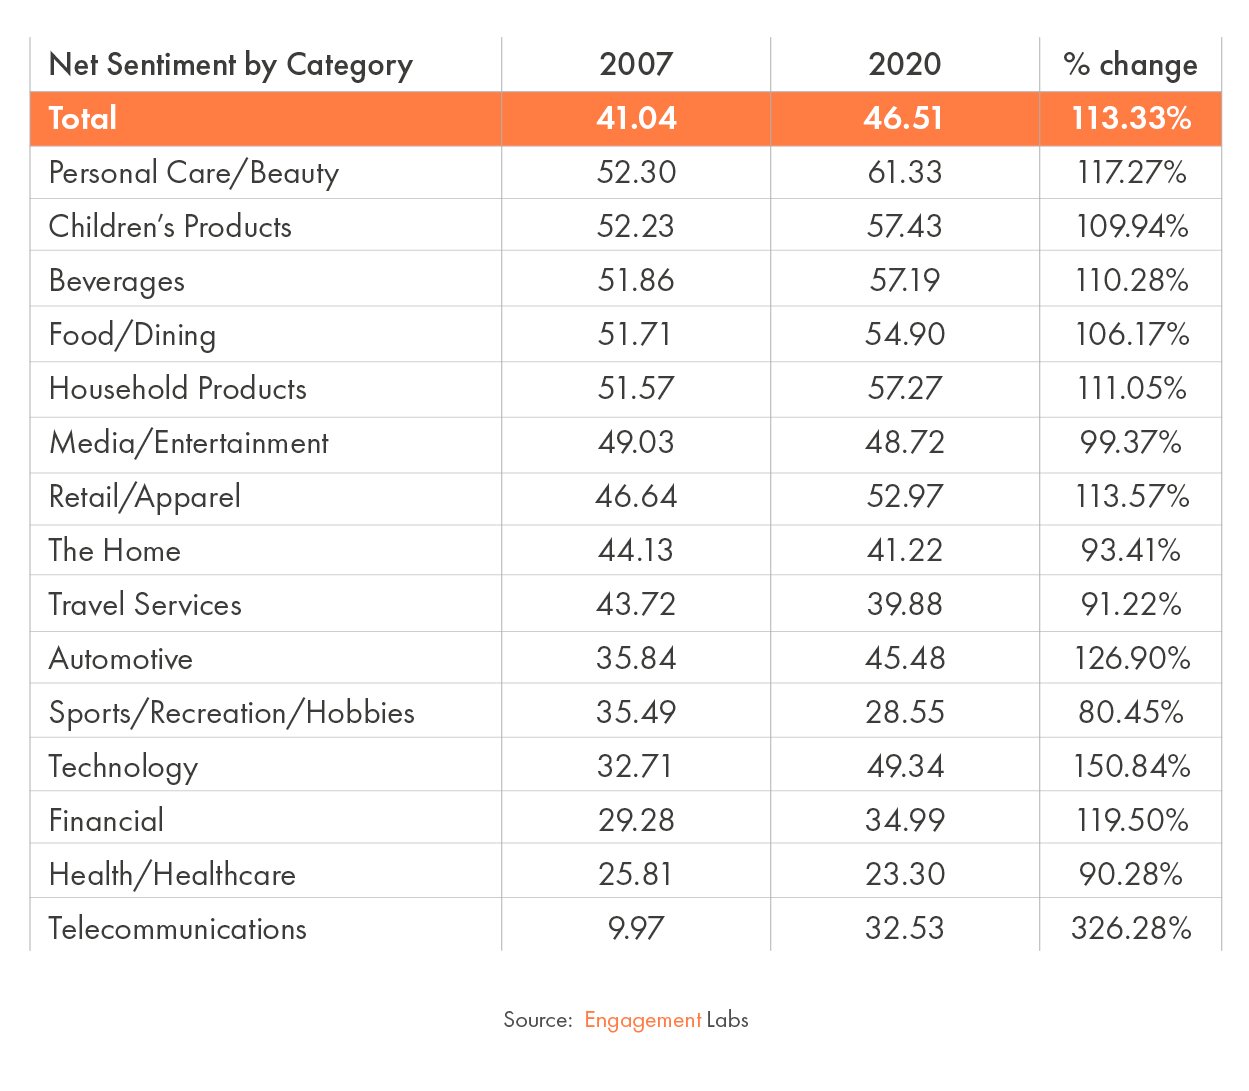 Categories with the highest net sentiment are personal care/beauty, children’s products, beverages, food/dining, and household products. All have net sentiment scores in the high 50’s or low 60s, and all have seen increases since 2007. Personal care/beauty’s net sentiment is up 17%.
Categories with below average net sentiment include health/healthcare, sports/recreation/hobbies, telecom and financial services. Notably, telecom’s net sentiment was a paltry +10 back in 2007 and has now risen sharply to +33, a gain of 226%. Health/healthcare’s net sentiment has declined by 10%, to +23.
 Offline WOM Was Mostly Face-to-Face Then. And Still Is.
Our firm gained notoriety when we published statistics in our early years that over 90% of WOM takes place offline. At the time, 74% was face-to-face, and another 17% was by phone.
Today, even during the pandemic, 66% of WOM is face-to-face, and phone remains even at 17%, for a total of 83%. In the year prior to the pandemic, face-to-face was at 71%, nearly identical to where it was nearly 15 years earlier.
Of the remainder, the next biggest factor is IM or texting, which accounts for nearly 8% today (they were less than 3% in 2007), video chats account for 3% today (and were unmeasured then), and 3% take place on social media (vs. 1% in 2007).
 Digital Media Drives Offline WOM
Media and marketing play an important role in driving word of mouth conversation. What people see on TV or in digital, at the point of sale or in promotions, or via email, radio, magazines or direct mail – all help to spark people to talk.
In our early days, TV was the biggest media driver, followed by digital media of all types. Today, digital is by far the biggest force, growing by 116% since 2007. Nearly a quarter of all offline WOM now include people talking about things they see in digital media. It is a phenomenon we have dubbed, from URL to IRL: How Digital Marketing Drive Conversation, Online and in Real Life, noting that “if you’re a brand, you need an entirely new and holistic approach that bridges the online and offline divide.”
TV, meanwhile, remains the second most important factor, but at a level that is close to 20% less than it was ‘back in the day.’
Real Relationships Still Rule, Even in a Digital Marketplace
We wrote a book a few years ago called The Face-to-Face Book: Why Real Relationships Rule in a Digital Marketplace. It was true then, and as these statistics attest, it remains as true today.
Don’t get us wrong, we completely believe in the importance of social media. We also know that it’s not a replacement for offline WOM. That’s why we created our TotalSocial platform, providing an integrated view of offline and online.
As our analytics demonstrate, the two are very different AND about equally important in driving business outcomes. Our purpose is to sound a clarion call for an integrated, holistic approach to social engagement that measures and activates both offline and online advocacy, and to avoid the trap of focusing disproportionately or even exclusively on social media at the expense of offline.
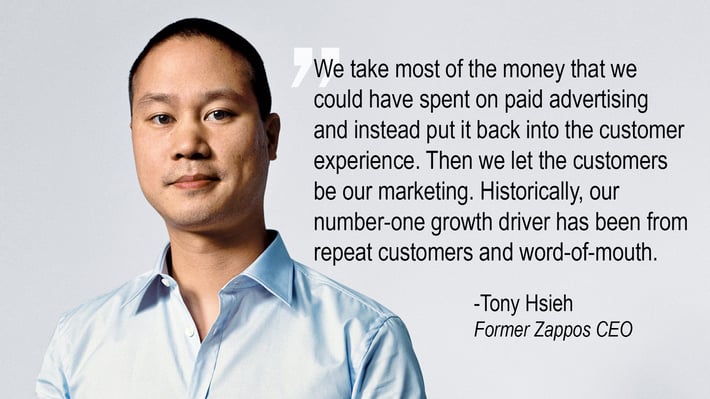
As our long-time client and friend, Greg Pharo, Global Director, Media Analytics & Advertising Research at The Coca-Cola Company said in a recent Q&A when we asked him about the relationship between social media and offline WOM:
“It’s like breathing: we have two lungs and we need to use both of them. Social conversations are important, but offline WOM is even more important. We should measure both using fit-for-purpose methods and understand that integrated marketing communication planning requires both to succeed.”